How we implemented centralized logging for four ECS Fargate microservices using Grafana Loki and Fluent Bit sidecars, cutting debugging time by 90% and reducing logging costs by 60%.
SP
Saurabh Parmar
Author
Updated 4 min read
How we implemented centralized logging for four ECS Fargate microservices using Grafana Loki and Fluent Bit sidecars, cutting debugging time by 90% and reducing logging costs by 60%.
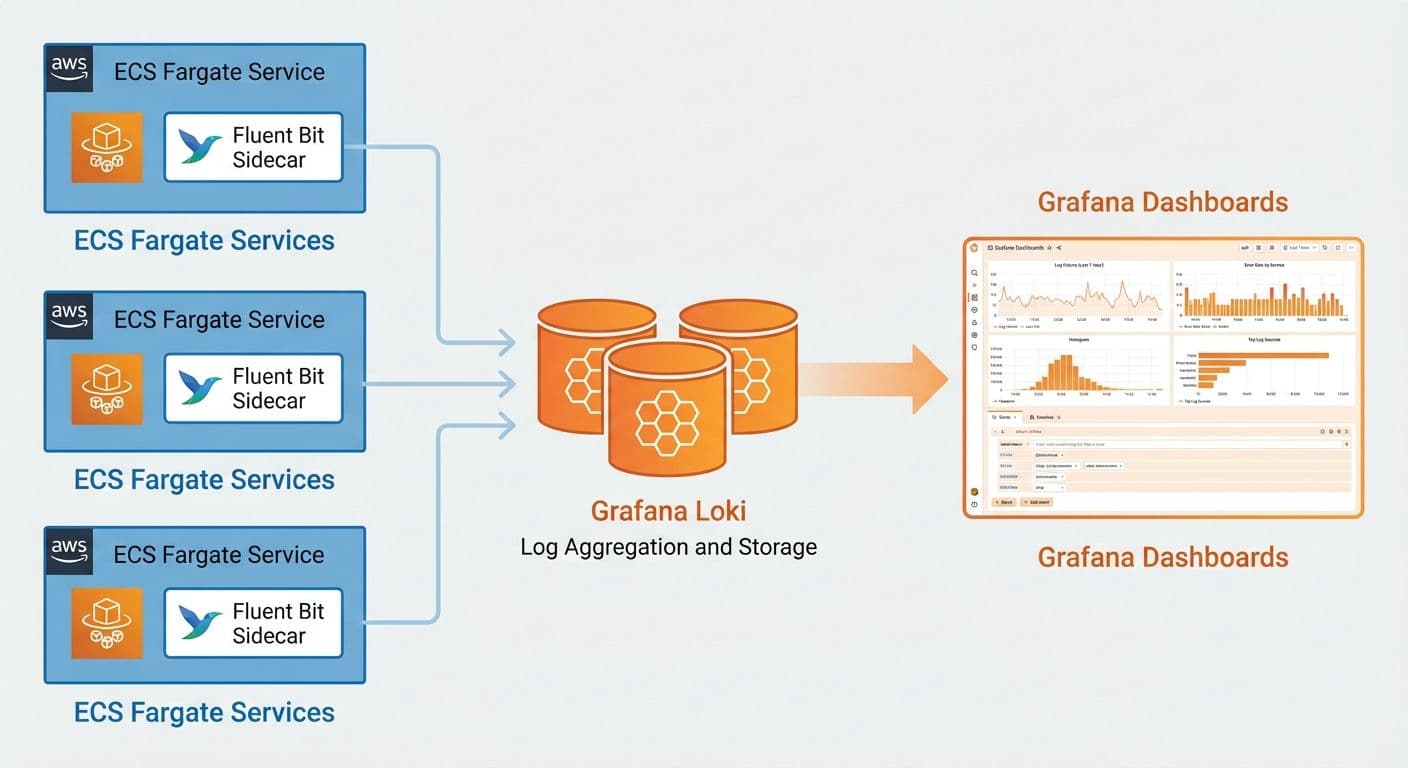
When you run multiple microservices on ECS Fargate, log aggregation quickly becomes a core operational concern. In this guide, we walk through how we implemented centralized logging with Grafana Loki and Fluent Bit sidecars for a travel platform running four microservices.
With several ECS services, logs naturally end up scattered across multiple CloudWatch log groups and streams. Developers were:
We needed centralized logging with powerful query capabilities and low operational overhead.
We evaluated traditional ELK-style stacks and CloudWatch-only approaches, but settled on Grafana Loki because it offered:
The result is a logging platform that’s both powerful and economical for ECS Fargate workloads.
ECS Service → Fluent Bit Sidecar → Loki → Grafana
↓ ↓ ↓ ↓
App Logs Log Processing Storage Queries
Each ECS task runs a Fluent Bit sidecar (via FireLens) that ships logs to Loki. Grafana is used as the query and visualization layer.
We use AWS FireLens (ECS’s native log router) to run Fluent Bit as a sidecar in each task definition.
ContainerDefinitions:
Name: log-router
Image: amazon/aws-for-fluent-bit:latest
Essential: true
FirelensConfiguration:
Type: fluentbit
Options:
enable-ecs-log-metadata: 'true'
LogConfiguration:
LogDriver: awslogs
Options:
awslogs-group: /ecs/firelens
awslogs-region: us-east-1
awslogs-stream-prefix: firelens
Key points:
enable-ecs-log-metadata: 'true' injects ECS metadata (task, cluster, container, etc.) into log records./ecs/firelens) for troubleshooting the pipeline.Your application containers then use the awsfirelens log driver so their logs are routed through this sidecar.
We configure Fluent Bit to send all matched logs to Loki:
LogQL is Loki's query language, similar to PromQL. Here are some practical queries for ECS workloads:
| JSON parsing: {service="order-service"} | json | level="error" |
|---|---|---|
| Latency tracking: {service="payment"} | json | duration_ms > 1000 |
Create Grafana dashboards that combine metrics and logs:
Set up alerts in Grafana based on log patterns:
After implementing Grafana Loki for our four ECS microservices:
Grafana Loki with Fluent Bit sidecars is an excellent choice for ECS Fargate logging. The combination of low storage costs, powerful LogQL queries, and native Grafana integration makes it ideal for microservices architectures. Start with basic log aggregation and progressively add dashboards and alerts as your observability needs grow.
Production-tested AWS WAF best practices for securing fintech applications, including recommended architecture, managed rule groups, CloudFormation configuration, monitoring, and common pitfalls to avoid.
Read articleHow we used AWS Cloud Map to solve service discovery, health-aware routing, and configuration drift in a 7-microservice transport management system running on ECS.
Read articleLearn how to orchestrate a multi-service blockchain validator stack using Docker Compose, including Sisu, Dheart, Deyes, Ganache, and MySQL, with health checks, logging, and multi-validator setups.
Read article